Industrial Energy Efficiency: 9 Costed Strategies for Indian Factories in 2026
Key Takeaway
Industrial energy efficiency is the cheapest available margin in a typical Indian manufacturing plant. Motors, pumps, fans and compressed air together account for roughly 70 percent of industrial electricity use, and most of that consumption is wasted on throttling, over-sizing and leakage. The nine strategies below are ranked by payback period, with indicative Indian cost and return figures.
Figure 1: Industrial electricity consumption breakdown by system, with realistic savings potential from each energy efficiency measure
Table of Contents
1. Establishing the Baseline
You cannot improve what you do not measure. Most Indian plants in the SME and mid-size segment have no sub-metering, which means the maintenance manager knows the total electricity bill in rupees and nothing about where it goes. That single gap is the reason energy efficiency programmes stall.
Start with a walkdown. Every large motor, pump, blower and compressor should be listed with its nameplate rating, its actual running load, and its annual hours of operation. The gap between nameplate and actual load is usually the first free win: an over-sized motor running at 30 percent load is not efficient, because a large fraction of its rated current is simply lost as copper loss while it does no mechanical work.
Sub-metering is the highest-return instrumentation investment a plant can make. For a plant consuming 400 kW continuously at an average tariff of INR 9 per kWh, annual consumption is roughly 400 x 8,760 x 9 = INR 31.5 million, or about USD 380,000. A three-phase power meter with logging costs INR 25,000 to INR 60,000 per point. Fourteen meters across the major systems cost about INR 6 lakh and pay for themselves the moment they reveal a compressor running unloaded over a weekend.
Avoid two common mistakes. First, do not begin with an energy audit bought as a one-off report from a consultant; a report that sits in a drawer changes nothing. Buy the meters, and own the data. Second, do not trust the energy meter reading alone, because it tells you consumption and not phase imbalance, which must be measured separately with a power analyser.
2. Motor Selection and Sizing
Motors are the single largest electrical load in most plants, commonly 40 to 55 percent of total consumption. Motor efficiency improvements have compounded steadily over two decades, and premium-efficiency motors (IE3, and IE4 where available) are now 3 to 8 percentage points more efficient than the IE2 units still common in Indian installations from the 1990s and early 2000s.
The arithmetic matters. Consider a continuous-duty 30 kW motor running 6,000 hours per year at INR 9 per kWh. The annual cost is 30 x 6,000 x 9 = INR 16.2 lakh. A 4 percentage point efficiency gain on a motor of this size reduces losses by roughly 7 percent of input, which is worth about INR 1.13 lakh a year. The replacement cost of a 30 kW IE3 motor is approximately INR 85,000 to INR 1.2 lakh depending on brand and enclosure. Payback is therefore under fifteen months, and the motor then pays out again every year for the remaining life of the asset.
The more common and more expensive problem is over-sizing. A process designed for 15 kW that was fitted with a 30 kW motor for “headroom” operates at half load. Below roughly 60 percent of rated load, motor efficiency falls off a cliff, and the fixed iron losses stay constant while output stays flat. In a CNC shop or a packaging line, retrofitting the correctly sized motor typically returns 10 to 20 percent of that motor’s energy bill in a single change, for a few thousand rupees.
For variable-load shafts, nothing beats sizing for the highest expected load and then controlling speed, which brings us to the next measure.
3. Variable Frequency Drives
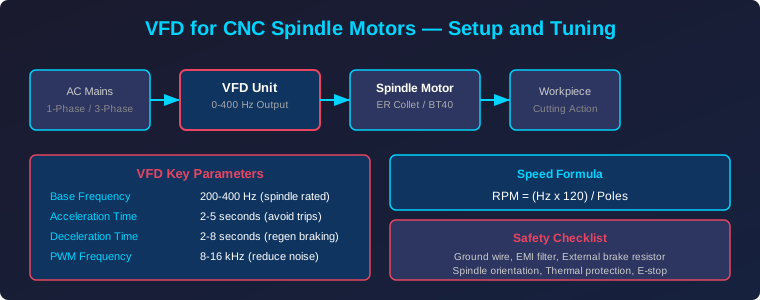
A variable frequency drive (VFD) is the highest-return single device in almost any industrial energy efficiency programme. Fans, pumps and compressors account for a large share of plant load, and they historically ran at fixed speed with throttling valves or dampers to control flow. Throttling converts useful pressure into heat and waste.
When a fan or pump is throttled, the power drawn follows the cube of speed. Reduce speed to 80 percent and the theoretical power falls to roughly 51 percent of full speed. Reduce to 70 percent and power falls to about 34 percent. In a chilled water plant, a modest speed reduction from throttling control typically cuts fan energy by 30 to 45 percent, because the flow demand on the cooling side rarely requires full design speed.
Typical Indian VFD pricing for a 15 kW unit is INR 90,000 to INR 1.8 lakh from domestic brands, and INR 2.5 lakh to INR 4 lakh from European and Japanese brands. On a 15 kW fan running 5,000 hours at 35 percent saving, the annual benefit is 15 x 0.35 x 5,000 x 9 = INR 2.36 lakh, giving roughly 5 to 16 month payback depending on brand.
Harmonics and power quality are the real reason energy efficiency projects get blocked. A VFD is a non-linear load and it injects harmonics onto the supply. Older six-pulse drives produce a 5th harmonic current of 30 to 40 percent of fundamental. The correct engineering answer is an active front-end drive, or a drive with an appropriate output reactor and a properly sized line filter, and never a compromise of undersizing the feeder cable to save money.
Commissioning discipline matters more than brand. The most common failure mode is setting minimum frequency too low on a pump or fan, which forces the motor into a cooling-poor state at low speed and can overheat it. A good rule is to keep minimum frequency at 20 Hz or above unless the drive’s own cooling curve explicitly permits lower.
4. Pumps and System Affinity Laws
Pumping is where the largest single waste in Indian industry tends to hide. A pump that must deliver 30 m3/h through a long pipeline is frequently selected to deliver 60 m3/h, and the excess is dissipated across a throttling valve that runs continuously. The pump burns full power to do work the system throws away.
The affinity laws make the case concrete. Pump flow scales directly with speed, head scales with the square of speed, and power scales with the cube. That last relationship is why even small speed changes are so valuable, and why a pump that has been throttled down to 60 percent flow has almost certainly had its speed left at 100 percent, wasting a large fraction of its input power.
Two interventions give most of the benefit. The first is a properly sized VFD on the pump, sized to the actual duty point rather than the maximum conceivable load. The second is hydraulic rebalancing, which means trimming impeller diameters or correcting the system curve so the pump naturally lands near its best efficiency point. A well-matched pump at its best efficiency point uses 15 to 25 percent less power than the same pump installed at the wrong point on its curve.
For a typical 45 kW transfer pump running 7,000 hours per year, moving from throttled control to a properly sized VFD at the true duty point frequently yields 25 to 35 percent reduction. At INR 9 per kWh that is 45 x 0.30 x 7,000 x 9 = INR 8.5 lakh a year, against a VFD and installation cost of roughly INR 3 lakh. Payback lands inside four months, which is faster than almost any other capital project on this list.
Add a simple discipline that costs nothing: run standby pumps at zero flow. A pump circulating against a closed isolation valve generates heat, not flow, and wears the impeller and bearing for nothing.
5. Compressed Air Leakage
Compressed air is expensive energy that has already been converted from electricity into pressure and then, in most plants, thrown away through leaks and inappropriate use. It is typically 7 to 10 percent of plant electricity, which makes it the most expensive utility per unit of delivered energy in most factories.
Leaks are the primary loss. An orifice of 3 mm diameter at 7 bar leaks roughly 30 standard cubic feet per minute, and at a typical Indian industrial tariff that single leak costs about INR 60,000 per year. A plant with 30 such leaks is bleeding away more than INR 18 lakh annually. Ultrasonic leak detection cameras are now available in India from INR 1.2 lakh, and rented services cost a few thousand rupees per day, which is often the better option for a first survey.
Second on the priority list is misuse. Blow-off air used to clean parts should almost always be replaced with compressed air blow guns with flow restrictors, which cut consumption by 40 to 70 percent on the same duty. Open-ended copper pipe outlets should be replaced with nozzle-and-hose assemblies. Safety-critical applications such as food and pharmaceutical lines are the exception, where blow-off is mandated for contamination control.
Third, receivers and undersizing. Compressors should run at a stable part-load rather than cycling on and off, which wastes most of the energy in each start cycle and causes rapid wear. A properly sized receiver, commonly sized at about 1 minute of free air delivery per compressor, smooths cycling and extends the time between starts.
Finally, pressure reduction. Plants often run 7 to 8 bar because equipment was once rated for it. Reducing the header to exactly what the end-use requires, commonly 6 bar, reduces power draw by roughly 5 percent because compressor specific power falls with discharge pressure.
6. Power Quality and Harmonics
Energy efficiency and power quality are usually treated as separate disciplines, but in practice they interact constantly. Uncorrected power factor, excessive harmonics, unbalanced phases and loose connections all raise energy consumption while also damaging the very motors and drives a plant relies on.
Power factor is the easiest and fastest to fix. A plant running at 0.75 power factor at 400 kW draws 533 kVA from the supply for 400 kW of useful work. Correcting to 0.95 with a capacitor bank reduces that to 421 kVA, releasing 112 kVA of capacity on the transformer and the incomer cable without spending anything on generation. For a plant paying an LT-HT tariff with a kVA demand component, this reduces the demand charge directly, and the payback on an automatic power factor correction panel is typically four to ten months.
Harmonics behave differently. Total harmonic distortion above about 10 percent on a motor’s supply causes extra heating in the core and windings, adds noise, and shortens bearing life. A distorted current waveform can raise motor losses by 3 to 12 percent with no change in mechanical output at all. That is pure additional energy cost, and it is exactly the kind of loss that sub-metering alone will never reveal, because the meter reads true RMS kWh correctly and the waste still happens.
Phase imbalance is the quiet killer. A three-phase motor with 2 percent current imbalance can see roughly 6 times that figure in additional heating, and motors sitting on imbalanced phases age several times faster. A handheld power analyser measuring INR 80,000 to INR 4 lakh is the only practical way to find this, and it should be a standard annual check.
The corrective actions are increasingly available as service rather than capital. A power quality audit costs INR 50,000 to INR 2 lakh, and the remedies, whether capacitor banks, active harmonic filters or motor rewinds, are usually justified by avoiding equipment failure alone even before the energy savings are counted.
7. Thermal Management and Insulation
Heating and cooling typically account for a further 20 to 30 percent of plant energy. The lowest-hanging fruit here is heat loss from bare pipe, valves and vessels, which is why insulation is the classic recommendation in every industrial energy efficiency guide. It is also correct, and the payback is often under a year.
The physics is straightforward. Bare steam pipe at 200 degrees Celsius radiates and convects heat continuously to ambient. Insulating the same pipe with glass wool and a cladding cuts the heat loss by roughly 80 to 90 percent. For a 50 metre run of bare 100 mm steam line, the annual heat loss in a typical Indian climate can be substantial, and that heat is simply discharged into the shop floor, raising the cooling load as well.
The trap is insulation that degrades. Many plants installed insulation in the 1990s and never inspected it, and damaged or missing sections on a long run can defeat the entire programme. Include insulation condition in the preventive maintenance schedule and check it visually every year, which costs nothing.
On the cooling side, the levers are variable speed air handling units, correctly set air-to-water and refrigerant charge, and door seals on process chillers and air-conditioned areas. Chillers are particularly sensitive to condenser fouling and to entering condenser water temperature, and cleaning condenser tubes twice a year typically recovers 5 to 10 percent of chiller energy for very little cost.
On any air-conditioned process area, the cheapest energy efficiency measure remains the door seal. Gaskets on loading bays and process doors that have hardened cost more in a year than the entire rest of the maintenance budget for that area.
8. Measuring ROI and Payback
Industrial energy efficiency projects should be judged on payback period, not on percentage energy saved, because a 40 percent saving on a small load can be worth less than a 5 percent saving on the plant’s biggest asset. Sort your list of candidate measures by payback and execute in that order.
| Measure | Typical saving | Indicative payback |
|---|---|---|
| Correctly size an over-loaded motor | 10 to 20% of that motor | Under 1 month |
| Fix compressed air leaks | 20 to 30% of air load | 1 to 3 months |
| Power factor correction | Demand charge reduction | 4 to 10 months |
| VFD on throttled pump | 25 to 35% of that pump | 3 to 8 months |
| VFD on HVAC and cooling fans | 30 to 45% of that fan | 5 to 16 months |
| Replace IE2 with IE3 motor | 3 to 8% of that motor | 8 to 24 months |
| Steam pipe insulation | 80 to 90% less heat loss | 6 to 18 months |
| Harmonic filter installation | 3 to 12% of affected load | 12 to 30 months |
Financing matters as much as engineering. Indian manufacturers typically fund this from internal cash flow, but several credible routes exist: the Bureau of Energy Efficiency’s recommended schemes routed through state distribution utilities, bank term loans for energy-saving projects, and supplier finance from drive and motor vendors who benefit from the sale.
Track results honestly. Take a sub-metering baseline before you start and re-measure at six and twelve months. Plants that genuinely track energy efficiency per unit of output achieve double-digit reductions over two to three years, while plants that install devices and never verify typically capture less than half the predicted benefit because setpoints drift and bypass valves get left open.
Finally, put the savings into the same account as production. An energy efficiency project that delivers INR 20 lakh a year and a production project that delivers INR 20 lakh a year are the same INR 20 lakh. In most Indian plants only one of them gets a capital request.
9. Related Reading
- Electronics and Microcontrollers Guides
- EVs and Solar Energy
- Engineering Tutorials and How-To Guides
10. Sources
- ISO 50001 Energy Management Systems
- US DOE Energy Saver: Industrial Motor Systems
- US Department of Energy: Industry Energy Efficiency
- International Electrotechnical Commission (IEC)
Key Takeaways
- Motors, pumps and compressed air together account for roughly 70 percent of industrial electricity use, so that is where industrial energy efficiency effort should go first
- Sub-metering costs INR 6 lakh for a mid-size plant and is the precondition for every other measure on this list
- Correctly sizing an over-loaded motor is the fastest payback action available, often under one month
- VFDs on throttled pumps typically pay back in 3 to 8 months because pump power follows the cube of speed
- Compressed air leaks at 3 mm cost roughly INR 60,000 a year each, which makes ultrasonic detection cheap by comparison
- Power factor correction frees real transformer capacity and reduces demand charges without spending on generation
- Harmonics and phase imbalance add 3 to 12 percent hidden motor losses that a standard kWh meter cannot detect
- Rank every energy efficiency measure by payback period, not by percentage saved, and fund the fast ones first